Ask an AI for chart analysis and you usually get a wall of text: "support around 4,150, resistance near 4,200". You then have to open your platform and find those levels yourself. With TraderWAI, your AI can show you instead: it decides what to mark, and TraderWAI draws it on the real chart, with live candles. The image appears right in the chat.
It works with Claude, ChatGPT and any other AI you connect to TraderWAI.
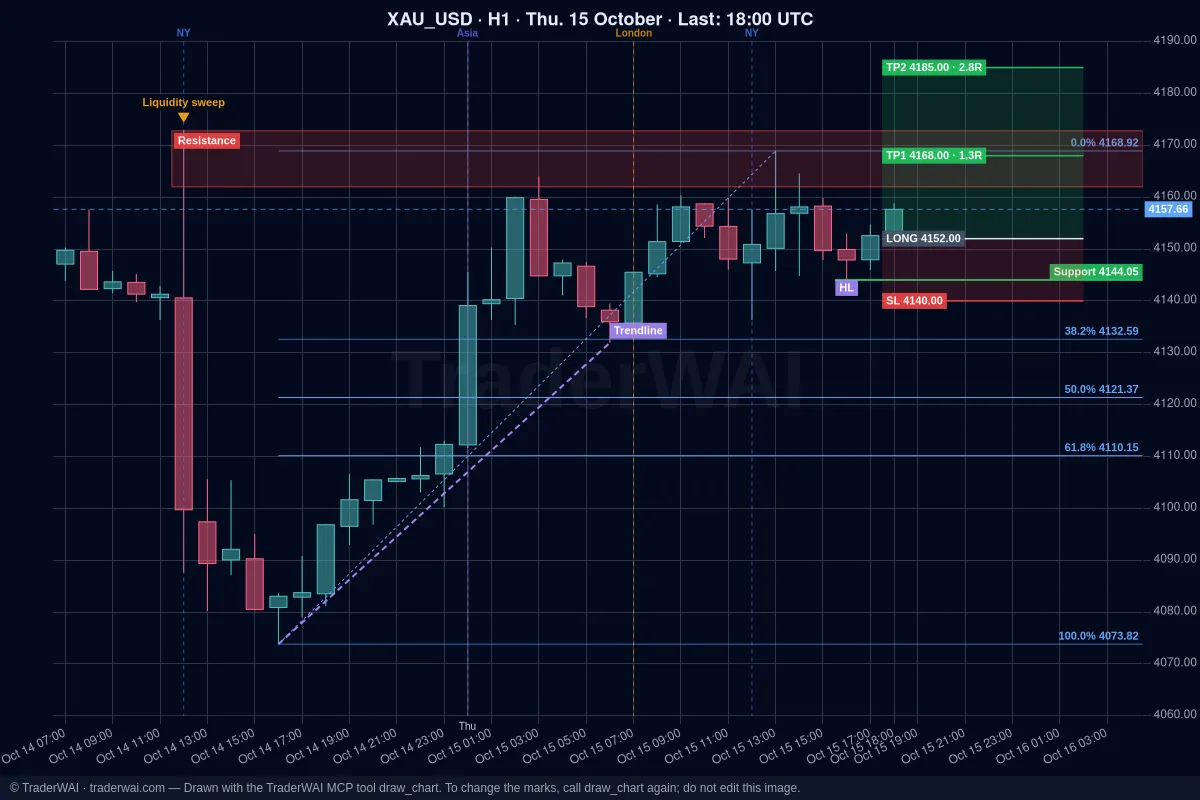
What your AI can draw
Your AI picks the marks that fit your question. It can draw:
- Horizontal levels: support and resistance.
- Zones: supply and demand.
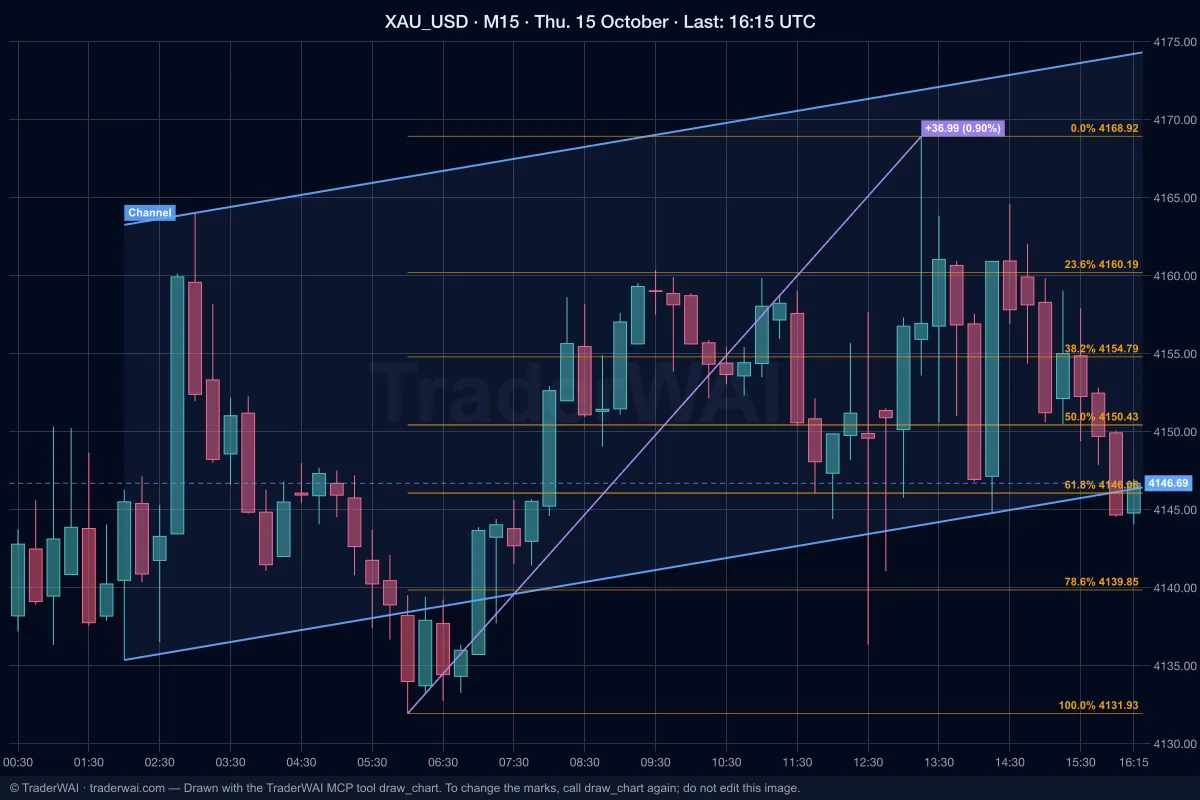
- Trendlines and channels.
- Vertical lines: session opens, news events.
- Marks on one or several candles: sweeps, rejections, signals.
- Text labels: HH, HL, BOS, CHoCH or anything else.
- Fibonacci, with the levels you want.
- The trade: entry, stop and one or more targets, each with its R.
- A measurement between two points.
- A projected path into future candles.
- Shapes: triangles, wedges, head and shoulders.
- Shading a period and highlighting candles.
Up to 30 marks per chart, on M1, M5, M15, H1, H4 and D. Symbols: forex, gold and silver, indices, oil and crypto from the TraderWAI feed.
Why the drawing is precise
This is not an AI-generated picture of a chart. The AI never guesses prices by looking at an image. Each candle is identified by its open time in UTC, and the exact prices come from the candle data. So when your AI says the swing low is at a certain price, the line is drawn at that price, on that candle.
That matters for levels you might trade from. A line drawn "roughly there" by an image model is decoration; a line placed from the candle data is something you can check against your own platform.
How to ask
No special commands. Describe what you want to see:
- "Draw the key support and resistance levels on gold H1, a Fibonacci of the last impulse, and the trade you would propose, with stop and targets."
- "Mark the liquidity sweep and the entry zone on NAS100 M15."
- "Draw the structure of EUR/USD on H4 with HH, HL and the last BOS."
The more concrete you are about the symbol, the timeframe and what you want marked, the more useful the chart.
Iterate on the chart
The first drawing is a starting point. To change the marks, ask your AI to draw it again with the change:
- "Move the resistance to the high of yesterday's session."
- "Add a Fibonacci of the last move up."
- "Remove the trendline and mark the channel instead."
- "Show the same levels on M15."
Each new request produces a fresh image, so you can go back and forth until the chart shows exactly what you want to discuss.
Free plan and paid plans
- Free: 5 marked charts a day.
- Plus, Trader and Max: unlimited marked charts.
Looking at charts without marks, and asking for analysis, is unlimited on every plan, including Free. Every image carries the © TraderWAI stamp. See pricing for the full comparison.
How to connect
- Add TraderWAI to your AI as a connector with the URL
https://mcp.traderwai.com. - Sign in with Google. If you don't have a TraderWAI account yet, it's created in this step.
- In a chat, enable TraderWAI and ask for a chart. To also read your account and place orders, connect a broker in Settings → Brokers → Add account.
The connect page walks you through it for each AI. For the full setup with a broker, see Claude + MetaTrader 5 or ChatGPT + MetaTrader 5.
And then let it manage the trade
Once the levels are on the chart, the next step is acting on them. Your AI can turn the structure it drew into exit rules on an open position, for example "if an M15 candle closes below the last higher low, close the buy" or "at 1R, move the stop to break-even", and TraderWAI checks them every minute. See AI exit rules: CHoCH and break-even.
Common questions
Does it work with ChatGPT and Claude? Yes, and with any AI connected to TraderWAI, such as Grok, Gemini CLI, Copilot or Cursor.
My AI doesn't draw, it only describes the chart. If you connected TraderWAI before 15 October 2026, disconnect it and connect it again in your AI. The list of tools is saved when you connect, so the drawing tool only appears after reconnecting.
Can I edit the drawing by hand? No. To change the marks, ask your AI to draw it again with the changes.
Does marking a chart place an order? No. A marked chart is only an image. Orders are a separate request and, by default, wait for your approval.
Trading involves risk. A marked chart is an analysis aid, not a guarantee of results.