GBP/USD today: key levels
Market closed: showing the last sessionTrading day: Friday, October 23, 2026
Updated Oct 24, 19:38 UTC · last candle Oct 23, 20:56 UTC
Today in brief
The market is closed. GBP/USD finished the session at 1.33710, down 0.00324 (0.24%) from the previous close of 1.34034.
Price is inside the previous day's range (1.33548–1.34198): 0.00488 below the high and 0.00162 above the low.
The Asian session (00:00–07:00 UTC) ranged from 1.33811 to 1.34076, a range of 0.00265 (37% of the daily ATR), and price is now below that range.
The day's range is 0.00469, 66% of the 14-day ATR (0.00715).
Unfilled H1 fair value gaps in the last 48 hours: 1. The most recent is a bearish gap at 1.33990–1.34020.
Key levels
| Level | Price | Distance | In ATRs |
|---|---|---|---|
| Current price | 1.33710 | ||
| Previous day high | 1.34198 | +0.00488 (+0.36%) | +0.68× |
| Previous day low | 1.33548 | −0.00162 (−0.12%) | −0.23× |
| Previous day close | 1.34034 | +0.00324 (+0.24%) | +0.45× |
| Asian session high | 1.34076 | +0.00366 (+0.27%) | +0.51× |
| Asian session low | 1.33811 | +0.00101 (+0.08%) | +0.14× |
| Today's open | 1.34036 | +0.00326 | |
| Today's high | 1.34076 | +0.00366 | |
| Today's low | 1.33607 | −0.00103 | |
| ATR (14, daily) | 0.00715 |
Distance = level minus current price (and as a % of price). ATR = average daily range over the last 14 days.
Session ranges today (UTC)
Unfilled H1 fair value gaps
A gap between candle 1 and candle 3 of a three-candle move on the 1-hour chart. Listed while price has not traded all the way through it.
| Type | Zone | Formed (UTC) | Status |
|---|---|---|---|
| bearish | 1.33990 – 1.34020 | Oct 23, 02:00 | Not tested yet |
GBP/USD 1-hour chart
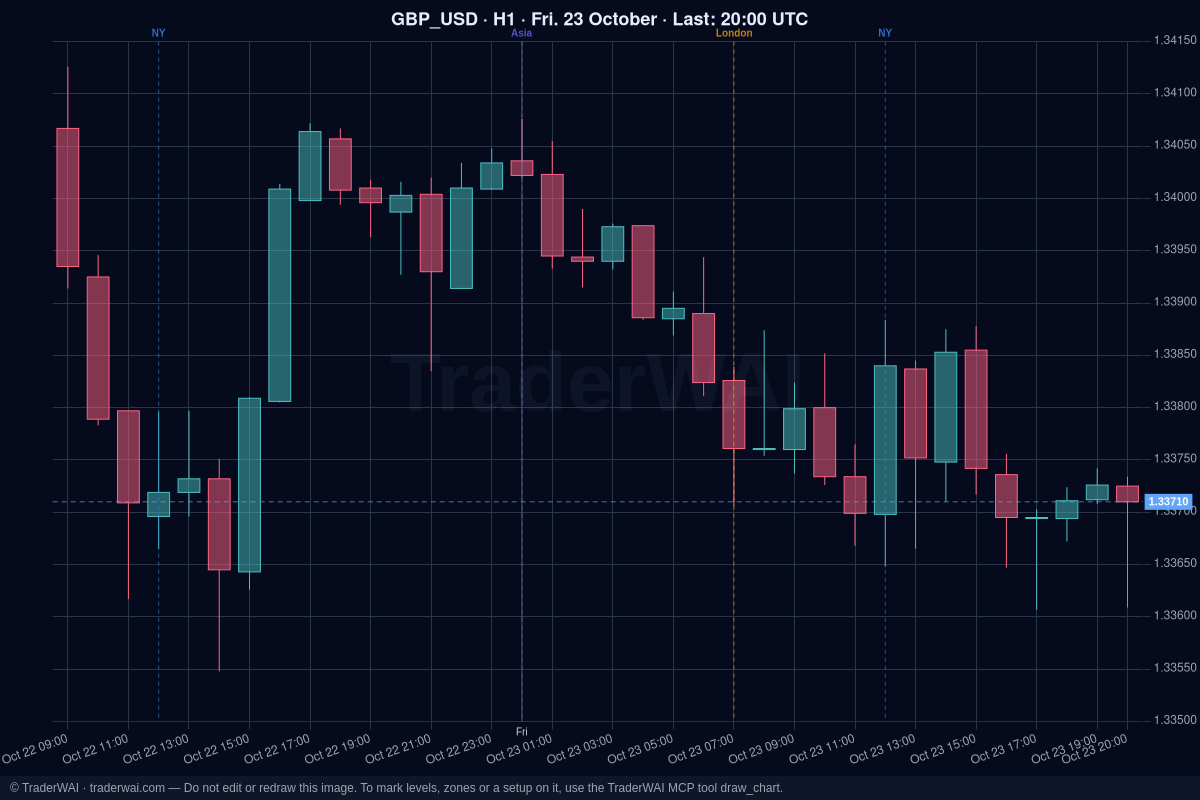
The same chart your AI gets from TraderWAI, refreshed every few minutes.
Analyse these levels with your AI, free
Connect TraderWAI to Claude or ChatGPT and your AI reads this chart live, marks these levels on it and backtests a setup on 1-minute data. Charts and analysis are free and unlimited.
In ChatGPT: Plugins → Add → Add custom MCP server, and paste https://mcp.traderwai.com.
Prefer read-only? TraderWAI Charts gives your AI charts, data and backtests without access to any account: https://mcp.traderwai.com/charts
Then ask:
Show me the GBP_USD H1 chart, mark yesterday's high and low and today's Asian range, and tell me where price is relative to them.How traders use these levels
Previous day high and low: the most watched reference levels of the day. Stops tend to sit just beyond them, so a run above yesterday's high or below yesterday's low often shows up as a sweep (a quick break and return) or as a breakout that keeps going.
Asian range: the high and low between 00:00 and 07:00 UTC. London often tests one side first; breakout and «Judas swing» traders define their entry and stop from these two levels.
Daily ATR: how far the market moves on an average day. If today's range is already close to the ATR, a lot of the day's move may already be done; it also helps size stops so they are not inside normal noise.
H1 fair value gaps: zones where price moved so fast it left a gap between candles. Price often comes back to them; traders watch whether they hold as support or resistance.
Frequently asked questions
How are these levels calculated?
From TraderWAI's 1-minute candles. Days are UTC days; for forex, gold and indices the short Sunday-evening session counts as part of Monday, so «previous day» on Monday is Friday. Sessions: Asia 00:00–07:00, London 07:00–16:00 and New York 13:00–21:00 UTC. ATR is the 14-day average true range (Wilder).
How often is this page updated?
Every 15 minutes or so while the market is open. At weekends forex, gold and indices show the last session (Friday); crypto updates every day.
Can my AI use these levels?
Yes. With TraderWAI connected, Claude, ChatGPT and other AIs can read the live chart and exact candles, draw these levels on a chart, backtest a rule on them and, if you want, turn it into a conditional order. Charts, data and analysis are free and unlimited.
Keep exploring
Real backtests of strategies on these levels
- Does buying gold at yesterday's low work? Backtest (last 30 days)
- Does the Asian range breakout on EUR/USD work? Backtest (last 30 days)
Guides
Educational information, not investment advice. Prices come from TraderWAI's reference feed and can differ slightly from your broker's quotes.